pyOMA - Operational Modal Analysis in Python#
pyOMA is an open-source Python toolbox for Operational Modal Analysis (OMA), developed by Simon Marwitz, Volkmar Zabel et al. at the Institute of Structural Mechanics (ISM), Bauhaus-Universität Weimar.
Operational Modal Analysis identifies structural modal parameters — natural frequencies, damping ratios, and mode shapes — from output-only ambient vibration measurements, without requiring knowledge of the excitation forces. This makes it the standard approach for large civil structures (bridges, towers, floors) where artificial excitation is impractical.
pyOMA implements all major OMA algorithms and supports both interactive exploration (Jupyter widgets, PyQt5 GUI) and fully automated batch processing (continuous monitoring systems).
Documentation: https://py-oma.readthedocs.io
Source Code: pyOMA-dev/pyOMA
Citing pyOMA: https://doi.org/10.5281/zenodo.14936576
About pyOMA#
pyOMA covers the full OMA workflow:
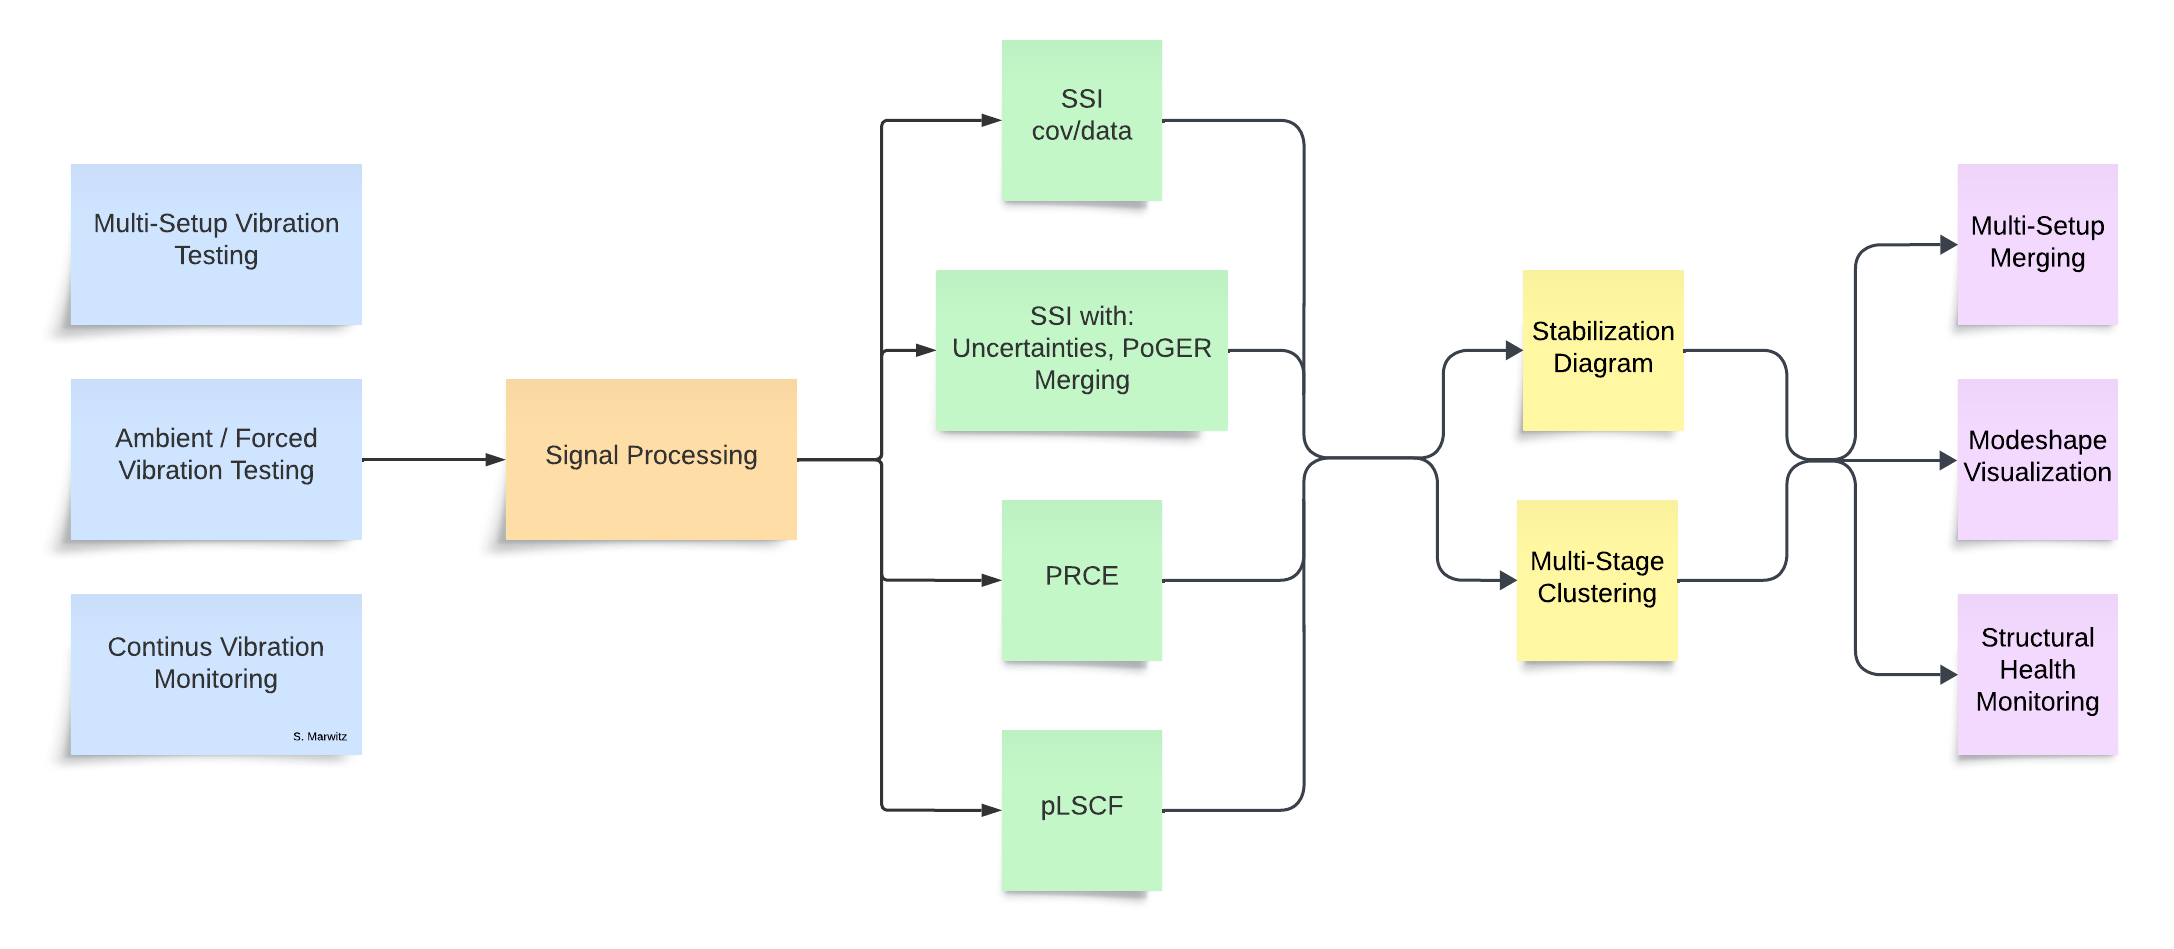
Signal pre-processing |
Decimation, anti-aliasing filters, bandpass filtering, cross-correlation and power spectral density estimation (Blackman-Tukey, Welch) |
System identification |
SSI-cov/ref ( |
Stabilization diagrams |
Automated pole clustering and selection
( |
Multi-setup OMA |
PoSER post-identification merging
( |
Mode shape visualization |
Animated 3-D mode shapes referenced to the structural geometry, including transformation of oblique (skewed-angle) sensor directions to global Cartesian coordinates |
Install#
Requirements: Python ≥ 3.9, NumPy, SciPy, Matplotlib (installed automatically).
git clone https://github.com/pyOMA-dev/pyOMA.git
cd pyOMA
pip install -e .
Optional extras — choose what you need:
|
Interactive stabilisation and mode-shape widgets for Jupyter notebooks |
|
Desktop PyQt5 stabilisation diagram and mode-shape GUI |
|
Test suite (pytest) and documentation builder (Sphinx) |
|
Both interactive frontends |
Getting started#
The Getting Started page walks through the five-step workflow (geometry → signals → pre-processing → identification → stabilisation) with code examples.
Three worked examples are provided (see the Examples page): single-setup SSI, PoSER multi-setup merging, and PoGER multi-setup merging — all using the bundled steel-frame dataset. The Example data: steel frame with 3D scanning laser vibrometer page describes that dataset in detail.
Each example is available both as a runnable Python script and as an interactive Jupyter notebook:
Scenario |
Script |
Notebook |
|---|---|---|
Single measurement setup |
|
|
Multi-setup — PoSER (merge after identification) |
|
|
Multi-setup — PoGER (merge before identification) |
|
Getting help#
Before opening an issue, try the following:
Check the Getting Started page and the API reference for the class or method you are using.
Verify your input files against the Input File Formats page (missing or mis-ordered keys are a common source of
KeyError/ValueError).Make sure channel numbers in
channel_dofs.txtmatch the columns remaining after anyDelete Channelshave been removed insetup_info.txt.Check NumPy, SciPy, and Matplotlib version compatibility. pyOMA requires NumPy ≥ 2.0; older versions will raise deprecation errors.
Search GitHub Issues — your problem may already be reported and answered.
Open a new issue at pyOMA-dev/pyOMA#issues and include:
a minimal reproducible example (ideally using the bundled test data),
the full traceback,
the output of
pip show pyOMA numpy scipy matplotlib.
Applications#
pyOMA is used daily for continuous ambient vibration monitoring of a guyed broadcasting mast (in operation since 2015) and has been applied in a range of academic and commercial campaigns including:
Bridges |
Long-term monitoring, seasonal modal tracking |
Towers and masts |
3D scanning laser vibrometer OMA, automated daily identification |
Wide-span floors |
Multi-setup OMA to cover the full spatial extent |
Laboratory structures |
Method validation, uncertainty quantification |
Selected publications:
Marwitz et al. “An Experimental Evaluation of Two Potential Improvements for 3D Laser Vibrometer Based Operational Modal Analysis”. Experimental Mechanics 57.8, 2017.
Marwitz et al. “Modalanalyse von Monitoringdaten eines Sendeturms”. Bautechnik 95.4, 2018.
Marwitz et al. “Operational Modal Analysis with a 3D Laser Vibrometer without External Reference”. IMAC 2016, Vol. 8.
Marwitz et al. “Automatisierte Modalanalyse und Langzeitmonitoring eines rotationssymmetrischen Turmtragwerks”. Baustatik-Baupraxis 13, 2017.
Marwitz et al. “Cross-Evaluation of two Measures for the Assessment of Estimated State-Space Systems in OMA”. IOMAC 2017.
Marwitz et al. “Betrachtung von Unsicherheiten in der Modalanalyse mit der SSI am Beispiel eines seilabgespannten Masts”. D-A-CH Tagung 2017.
Marwitz et al. “Modale Identifikation aus Langzeit-Dehnungsmessungen an einem Sendeturm”. VDI Baudynamik 2018.
Marwitz et al. “Relations between the quality of identified modal parameters and measured data obtained by structural monitoring”. ISMA 2018.
Zabel et al. “Bestimmung von modalen Parametern seilabgespannter Rohrmasten”. Baustatik-Baupraxis, 2020.
Marwitz et al. “Cross-Validation in Stochastic Subspace Identification”. IOMAC 2025.
Marwitz. “Quantification and Reduction of Polymorphic Uncertainties in Operational Modal Analysis”. PhD Thesis, Bauhaus-Universität Weimar, 2026.
Contributing#
Contributions are welcome. Please:
Fork the repository on GitHub and open a Pull Request.
Run the test suite before submitting:
pip install -e ".[dev]" && pytestVerify the documentation builds:
cd doc && make clean && make html
Good entry points for new contributors:
Beginner: improve existing example scripts, add missing GUI parts for pre-processing and OMA modules (ipywidgets and/or PyQt5)
Intermediate: add support for additional measurement file formats; improve documentation
Advanced: new mode-shape plot backend (pyvista / mayavi); variance estimation for pLSCF and PRCE; correct uncertainty estimation for SSI-data (Döhler / IOMAC paper); implement PreGER with uncertainty bounds
Project structure#
pyOMA/
├── pyOMA/
│   ├── core/
│   │   ├── PreProcessingTools.py   # GeometryProcessor, PreProcessSignals, SignalPlot
│   │   ├── ModalBase.py            # base class for all identification methods
│   │   ├── SSICovRef.py            # BRSSICovRef, PogerSSICovRef
│   │   ├── SSIData.py              # SSIData, SSIDataMC
│   │   ├── VarSSIRef.py            # SSI with uncertainty (variance) estimation
│   │   ├── PLSCF.py               # poly-reference Least-Squares Complex Frequency
│   │   ├── ERA.py                 # Eigensystem Realisation Algorithm
│   │   ├── StabilDiagram.py       # StabilCalc, StabilCluster, StabilPlot
│   │   ├── PlotMSH.py             # ModeShapePlot
│   │   ├── PostProcessingTools.py  # MergePoSER
│   │   └── Helpers.py             # ConfigFile, utility functions
│   └── GUI/
│       ├── StabilGUI.py           # PyQt5 stabilisation diagram
│       ├── PlotMSHGUI.py          # PyQt5 mode-shape viewer
│       └── JupyterGUI.py          # ipywidgets for Jupyter
├── doc/                           # Sphinx documentation source
├── input_files/                   # templates for config files
├── scripts/                       # example scripts and notebooks
├── tests/                         # pytest suite + bundled example data
└── pyproject.toml
The full API reference is available under API Reference:
Signal processing — GeometryProcessor, PreProcessSignals, SignalPlot
System Identification / Modal Analysis — BRSSICovRef, SSIData, VarSSIRef, PLSCF, ERA, PogerSSICovRef
Post-processing — MergePoSER, StabilCalc, StabilCluster, ModeShapePlot
Indices and tables#
Todo
- Beginner:
Creating missing GUI parts for pre-processing and OMA modules (ipywidgets and/or PyQt5)
Improvement of documentation where needed
- Intermediate:
Implementing support for various measurement file formats
- Advanced:
New mode-shape plot class based on pyvista or mayavi
Implementation of variance estimation for PLSCF, PRCE
Correct uncertainty estimation for SSI-Data (Döhler / IOMAC paper)
Implement PreGER with uncertainty bounds